Outliers are extreme values that deviate from other observations on data , they may indicate a variability in a measurement, experimental errors or a novelty. In other words, an outlier is an observation that diverges from an overall pattern on a sample.
Types of outliers
Outliers can be of two kinds: univariate and multivariate. Univariate outliers can be found when looking at a distribution of values in a single feature space. Multivariate outliers can be found in a n-dimensional space (of n-features). Looking at distributions in n-dimensional spaces can be very difficult for the human brain, that is why we need to train a model to do it for us.
Outliers can also come in different flavours, depending on the environment: point outliers, contextual outliers, or collective outliers. Point outliers are single data points that lay far from the rest of the distribution. Contextual outliers can be noise in data, such as punctuation symbols when realizing text analysis or background noise signal when doing speech recognition. Collective outliers can be subsets of novelties in data such as a signal that may indicate the discovery of new phenomena (As in figure B).
Most common causes of outliers on a data set:
- Data entry errors (human errors)
- Measurement errors (instrument errors)
- Experimental errors (data extraction or experiment planning/executing errors)
- Intentional (dummy outliers made to test detection methods)
- Data processing errors (data manipulation or data set unintended mutations)
- Sampling errors (extracting or mixing data from wrong or various sources)
- Natural (not an error, novelties in data)
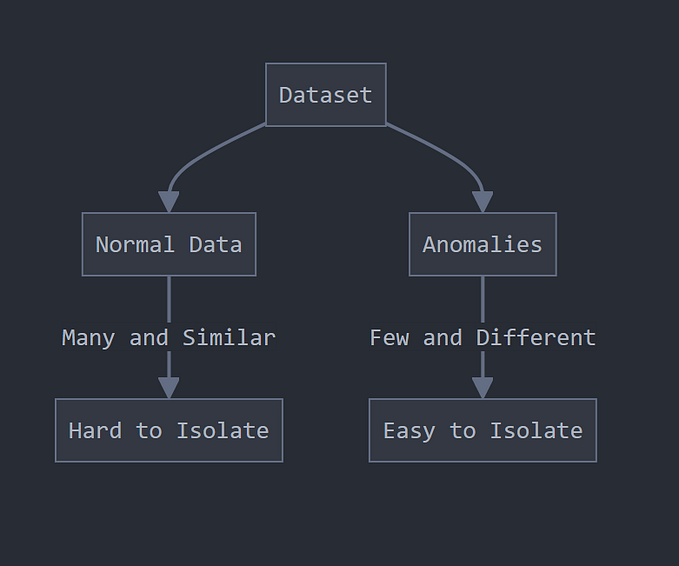
In the process of producing, collecting, processing and analyzing data, outliers can come from many sources and hide in many dimensions. Those that are not a product of an error are called novelties.
Detecting outliers is of major importance for almost any quantitative discipline (ie: Physics, Economy, Finance, Machine Learning, Cyber Security). In machine learning and in any quantitative discipline the quality of data is as important as the quality of a prediction or classification model.
When trying to detect outliers in a dataset it is very important to keep in mind the context and try to answer the question: “¿Why do I want to detect outliers?” The meaning of your findings will be dictated by the context.
Also, when starting an outlier detection quest you have to answer two important questions about your dataset:
- Which and how many features am I taking into account to detect outliers ? (univariate / multivariate)
- Can I assume a distribution(s) of values for my selected features? (parametric / non-parametric)
Some of the most popular methods for outlier detection are:
- Z-Score or Extreme Value Analysis (parametric)
- Probabilistic and Statistical Modeling (parametric)
- Linear Regression Models (PCA, LMS)
- Proximity Based Models (non-parametric)
- Information Theory Models
- High Dimensional Outlier Detection Methods (high dimensional sparse data)
Z-Score
The z-score or standard score of an observation is a metric that indicates how many standard deviations a data point is from the sample’s mean, assuming a gaussian distribution. This makes z-score a parametric method. Very frequently data points are not to described by a gaussian distribution, this problem can be solved by applying transformations to data ie: scaling it.
Some Python libraries like Scipy and Sci-kit Learn have easy to use functions and classes for a easy implementation along with Pandas and Numpy.
After making the appropriate transformations to the selected feature space of the dataset, the z-score of any data point can be calculated with the following expression:
When computing the z-score for each sample on the data set a threshold must be specified. Some good ‘thumb-rule’ thresholds can be: 2.5, 3, 3.5 or more standard deviations.
By ‘tagging’ or removing the data points that lay beyond a given threshold we are classifying data into outliers and not outliers
Z-score is a simple, yet powerful method to get rid of outliers in data if you are dealing with parametric distributions in a low dimensional feature space. For nonparametric problems Dbscan and Isolation Forests can be good solutions.
Dbscan (Density Based Spatial Clustering of Applications with Noise)
In machine learning and data analytics clustering methods are useful tools that help us visualize and understand data better. Relationships between features, trends and populations in a data set can be graphically represented via clustering methods like dbscan, and can also be applied to detect outliers in nonparametric distributions in many dimensions.
Dbscan is a density based clustering algorithm, it is focused on finding neighbors by density (MinPts) on an ‘n-dimensional sphere’ with radius ɛ. A cluster can be defined as the maximal set of ‘density connected points’ in the feature space.
Dbscan then defines different classes of points:
- Core point: A is a core point if its neighborhood (defined by ɛ) contains at least the same number or more points than the parameter MinPts.
- Border point: C is a border point that lies in a cluster and its neighborhood does not contain more points than MinPts, but it is still ‘density reachable’ by other points in the cluster.
- Outlier: N is an outlier point that lies in no cluster and it is not ‘density reachable’ nor ‘density connected’ to any other point. Thus this point will have “his own cluster”.
If A is a core point, it forms a cluster with all the points that are reachable from it. A point Q is reachable from P if there is a path p1, …, pn with p1 = p and pn = q, where each pi+1 is directly reachable from pi (all the points on the path must be core points, with the possible exception of q).
Reachability is a non-symmetric relation since, by definition, no point may be reachable from a non-core point, regardless of distance (so a non-core point may be reachable, but nothing can be reached from it!). Therefore a further notion of connectedness is needed to formally define the extent of the clusters found by this algorithm.
Two points p and q are density-connected if there is a point o such that both p and q are density-reachable from o. Density-connectedness is symmetric.
A cluster satisfies two properties:
- All points within the cluster are mutually density-connected.
- If a point is density-reachable from any point of the cluster, it is part of the cluster as well.
Sci-kit Learn has an implementation of dbscan that can be used along pandas to build an outlier detection model.
Again, the first step is scaling the data, since the radius ɛ will define the neighborhoods along with MinPts. (Tip: a good scaler for the problem at hand can be Sci-kit Learn’s Robust Scaler).
After scaling the feature space, is time to choose the spatial metric on which dbscan will perform the clustering. The metric must be chosen depending on the problem, an euclidean metric works well for 2 or 3 dimensions, the manhattan metric can also be useful when dealing with higher dimensional feature spaces 4 or more dimensions.
Then, the parameter eps (ɛ) must be chosen accordingly to perform clustering. If ɛ is too big many points will be density connected, if its too small the clustering will result in many meaningless clusters. A good approach is to try values ranging from 0.25 to 0.75.
Dbscan is also sensitive to the MinPts parameter, tuning it will completely depend on the problem at hand.
The complexity of dbscan is of O(n log n), it and effective method with medium sized data sets. Feeding data to the model is easy when using Scikit learn’s implementation. After fitting dbscan to the data clusters can be extracted and each sample is assigned to a cluster. Dbscan estimates the number of clusters by itself, there is no need to specify the number of desired clusters, it is an unsupervised machine learning model.
Outliers (noise) will be assigned to the -1 cluster. After tagging those instances, they can be removed or analyzed.
Real world application of DBSCAN in housing prices (red:normal, black: outliers)
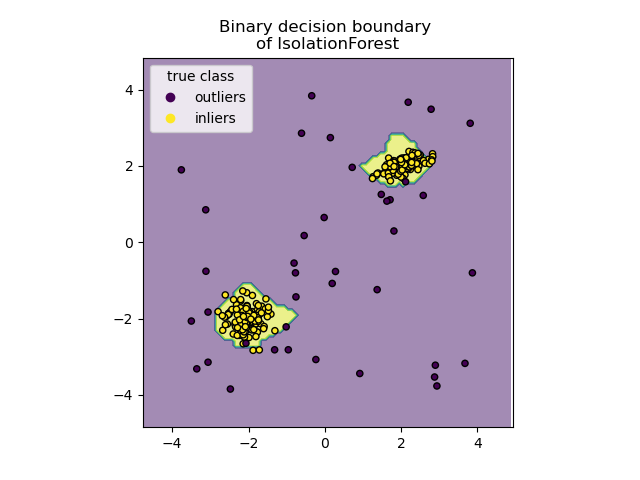
Isolation Forests
Last but not least, isolation forests are an effective method for detecting outliers or novelties in data. It is a relatively novel method based on binary decision trees. Sci-Kit Learn’s implementation is relatively simple and easy to understand.
Isolation forest’s basic principle is that outliers are few and far from the rest of the observations. To build a tree (training), the algorithm randomly picks a feature from the feature space and a random split value ranging between the maximums and minimums. This is made for all the observations in the training set. To build the forest a tree ensemble is made averaging all the trees in the forest.
Then for prediction, it compares an observation against that splitting value in a “node”, that node will have two node children on which another random comparisons will be made. The number of “splittings” made by the algorithm for an instance is named: “path length”. As expected, outliers will have shorter path lengths than the rest of the observations.
An outlier score can computed for each observation:
outlier score
Where h(x) is the path length of the sample x, and c(n) is the ‘unsuccessful length search’ of a binary tree (the maximum path length of a binary tree from root to external node) n is the number of external nodes. After giving each observation a score ranging from 0 to 1; 1 meaning more outlyingness and 0 meaning more normality. A threshold can be specified (ie. 0.55 or 0.60)
Tip: In the Scikit-Learn’s library the score is shifted by 0.5 and reversed, so it returns values from -0.5 to 0.5, bigger is less abnormal, and smaller is more abnormal.
Conclusions:
Z-Score pros:
- It is a very effective method if you can describe the values in the feature space with a gaussian distribution. (Parametric)
- The implementation is very easy using pandas and scipy.stats libraries.
Z-Score cons:
- It is only convenient to use in a low dimensional feature space, in a small to medium sized dataset.
- Is not recommended when distributions can not be assumed to be parametric.
Dbscan pros:
- It is a super effective method when the distribution of values in the feature space can not be assumed.
- Works well if the feature space for searching outliers is multidimensional (ie. 3 or more dimensions)
- Sci-kit learn’s implementation is easy to use and the documentation is superb.
- Visualizing the results is easy and the method itself is very intuitive.
Dbscan cons:
- The values in the feature space need to be scaled accordingly.
- Selecting the optimal parameters eps, MinPts and metric can be difficult since it is very sensitive to any of the three params.
- It is an unsupervised model and needs to be re-calibrated each time a new batch of data is analyzed.
- It can predict once calibrated but is strongly not recommended.
Isolation Forest pros:
- There is no need of scaling the values in the feature space.
- It is an effective method when value distributions can not be assumed.
- It has few parameters, this makes this method fairly robust and easy to optimize.
- Scikit-Learn’s implementation is easy to use and the documentation is superb.
Isolation Forest cons:
- The Python implementation exists only in the development version of Sklearn.
- Visualizing results is complicated.
- If not correctly optimized, training time can be very long and computationally expensive.